TradingPit
Analytics Engine.
A professional futures and crypto analytics platform built from scratch — real-time data feeds from Databento, Bybit and Binance, 100+ institutional price levels per instrument, a backtestable analytics engine, and a custom charting interface. Not a plugin. Not a template. Built entirely to spec.
Not a charting tool.
An edge engine.
TradingPit is a professional-grade analytics platform for futures and crypto traders. The goal was to build something that doesn’t exist anywhere else — a platform that streams institutional-quality market data in real time, calculates 100+ technical price levels automatically across 6 instruments, and provides a backtestable analytics engine to identify statistical edges in price behaviour.
This is not a Wordpress site with a charting plugin bolted on. Every component — the data ingestion pipeline, the level calculation engine, the chart renderer, the analytics backtester and the admin control centre — was built from the ground up to exact specifications.
Institutional levels.
Live on every chart.
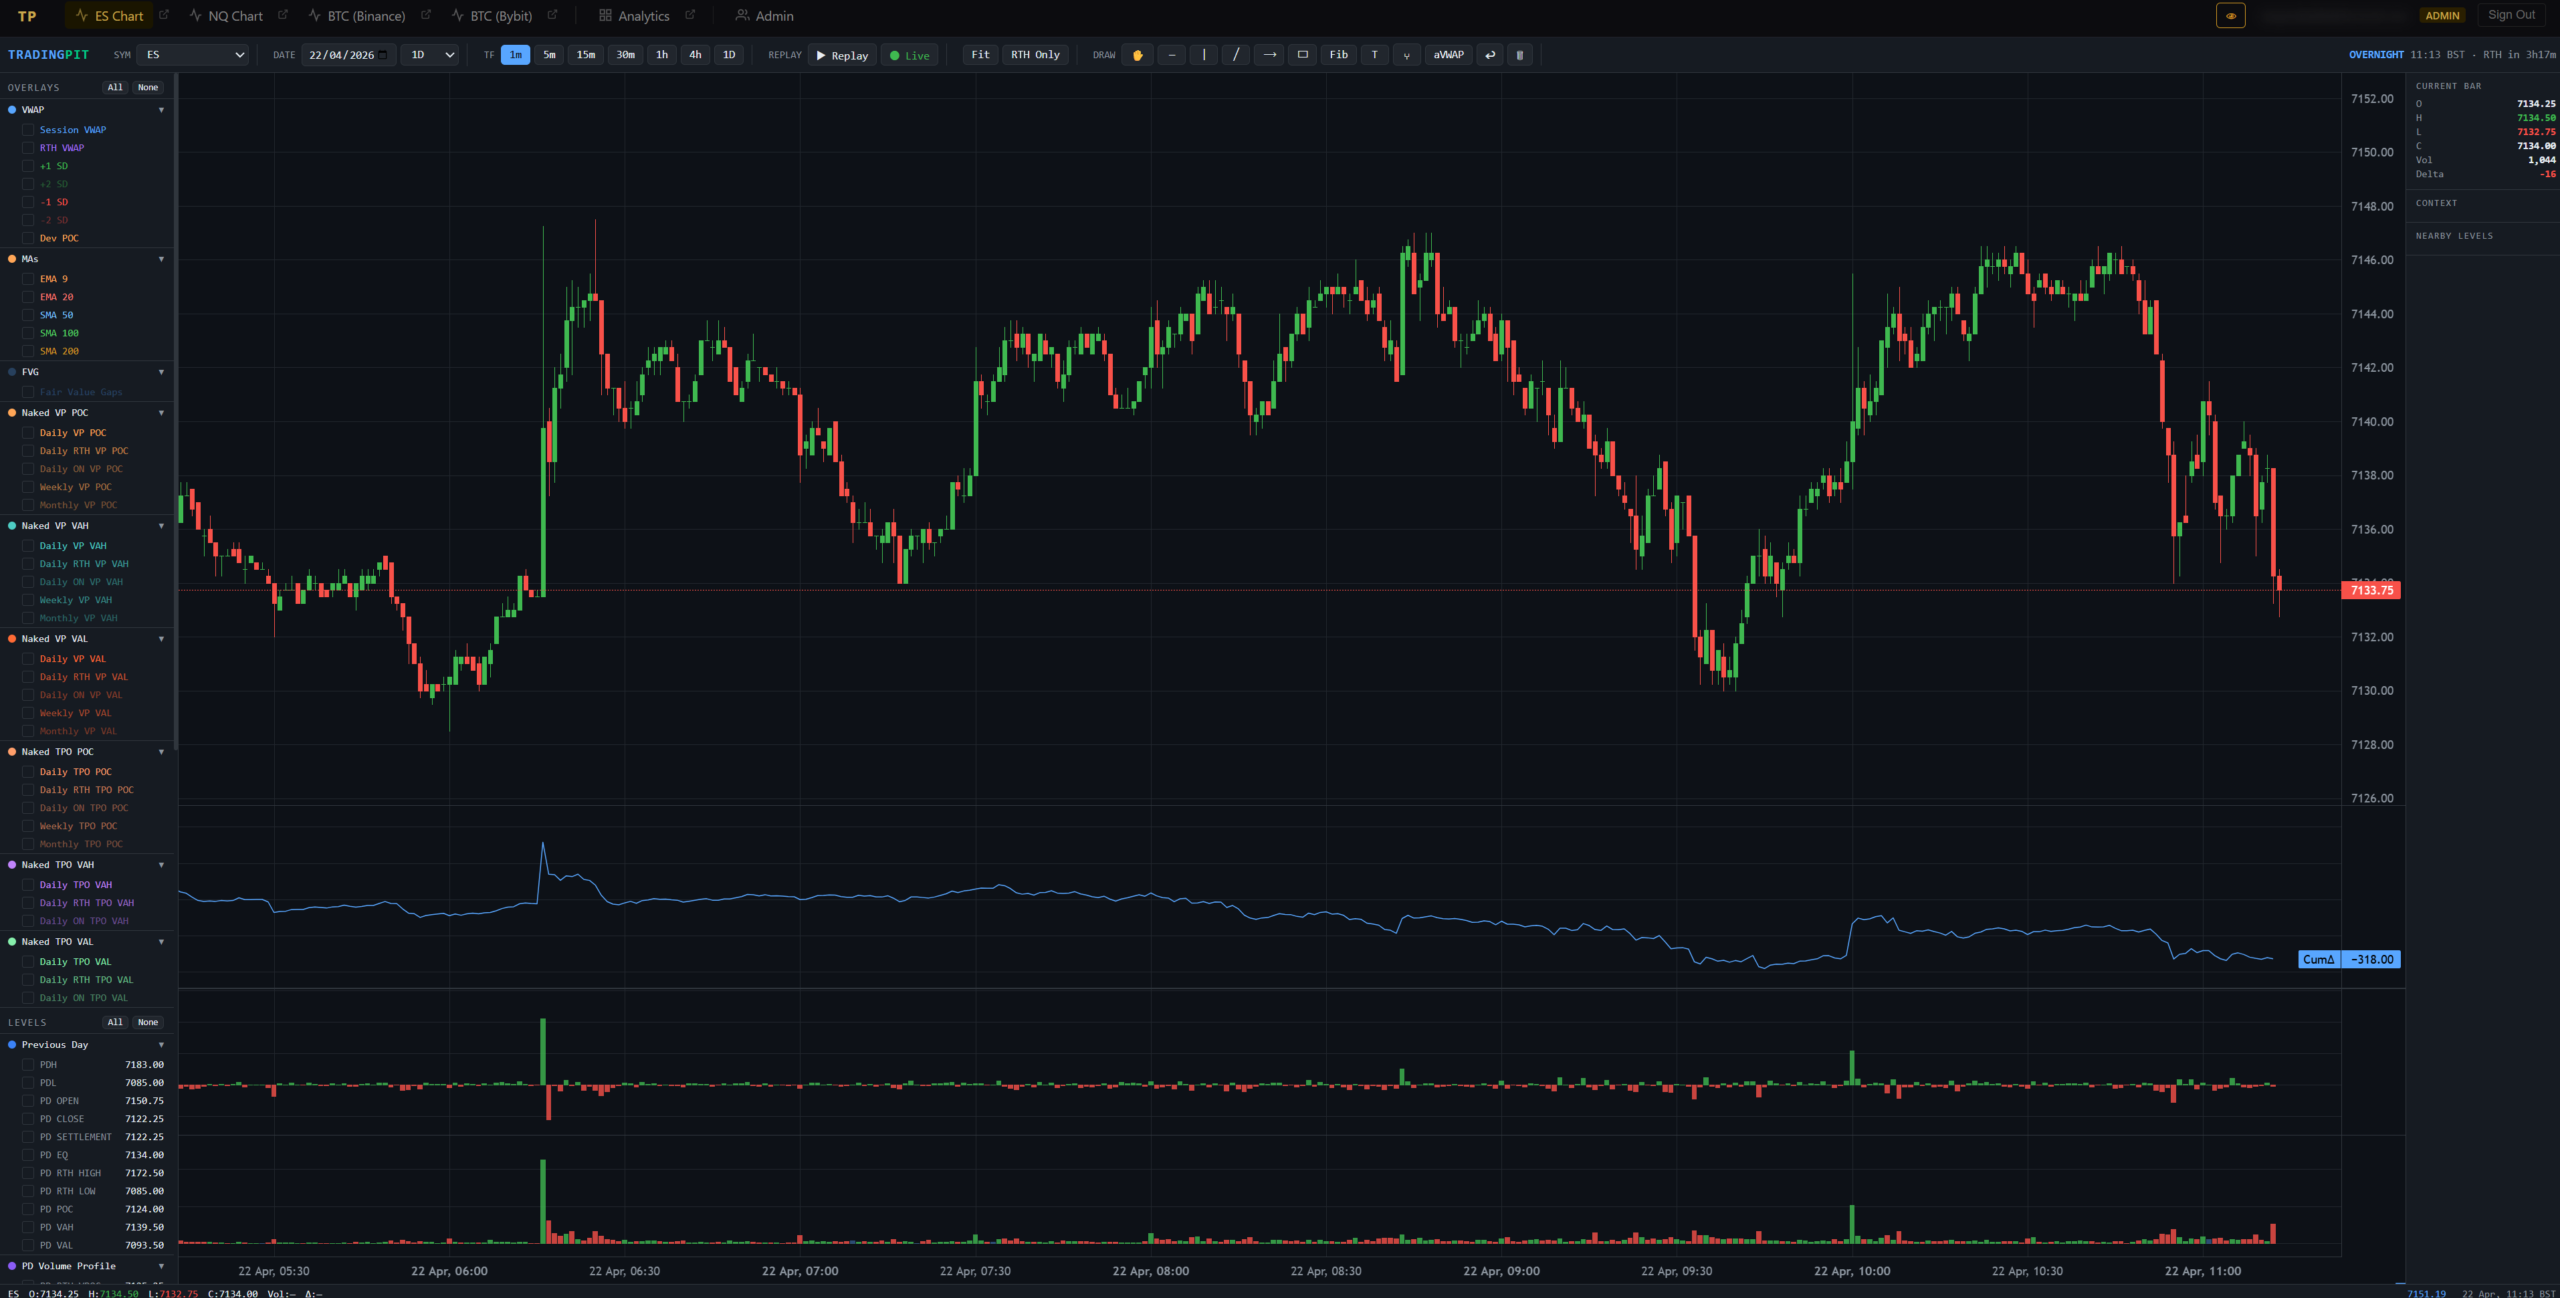
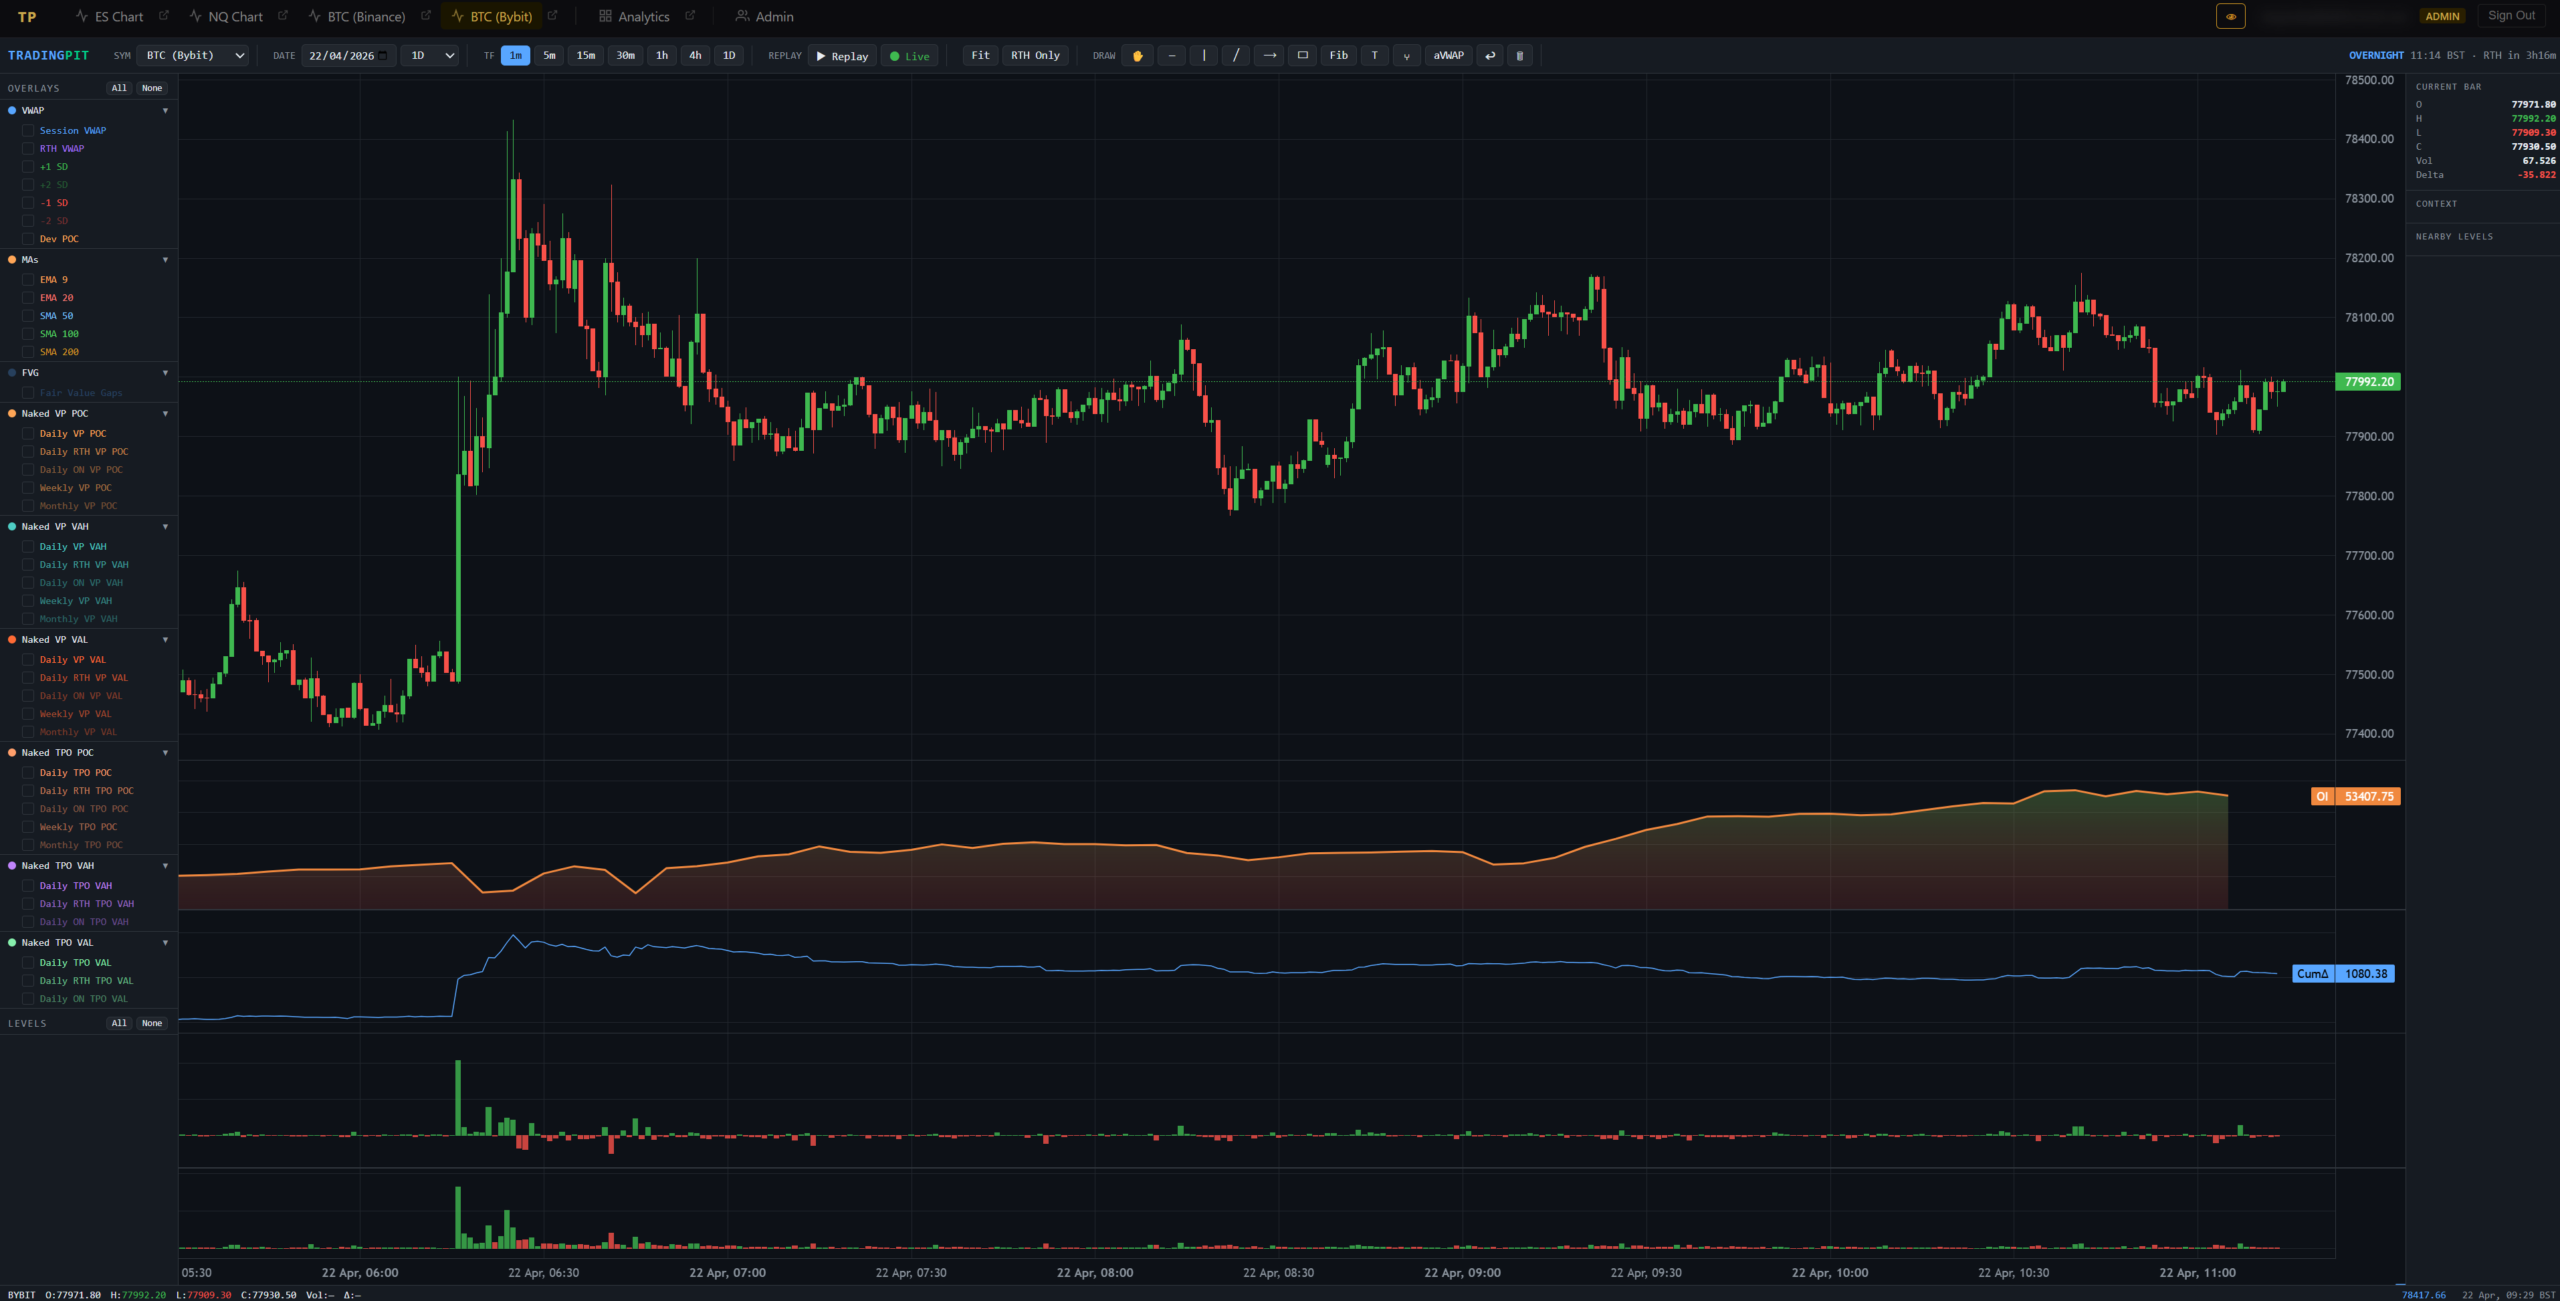
Every chart renders in real time with all active levels overlaid — VWAP, Naked VP POC, Naked VP VAH/VAL, Naked TPO POC, Moving Averages, Fair Value Gaps and previous Day/Week/Month structure. The sidebar lists every active level with its exact price, all toggleable independently. Traders can switch between ES, NQ, BTC (Binance), BTC (Bybit) and CME instruments from a single interface. A replay mode allows historical session review at any timeframe.
Three live API feeds.
One data pipeline.
The platform ingests live market data from three separate sources simultaneously. Each feed runs as an independent service, storing tick data directly to PostgreSQL in real time. The data pipeline builds 1-minute bars, calculates all price levels nightly and serves everything to the frontend via a FastAPI layer. 720,000+ bars stored and growing every minute markets are open.
Institutional-grade CME futures data. ES (E-mini S&P 500) and NQ (E-mini Nasdaq) live tick data — the same data feed used by professional trading firms. Tick-exact accuracy for volume profile and level calculations.
ES • NQ • BTC CME • MBT CMEReal-time BTC/USDT perpetual futures data via WebSocket. Live trade stream feeds directly into the tick storage system, building minute bars and open interest data that overlays onto the futures charts for cross-venue analysis.
BTC/USDT Perpetual • Live WebSocket • Open InterestReal-time BTC/USDT data from Bybit’s exchange via WebSocket stream. Provides a second crypto venue for cross-exchange comparison — critical for identifying divergences between major exchanges that often precede significant price moves.
BTC/USDT Perpetual • Live WebSocket • Cross-venueBacktest any setup.
Find the edge.
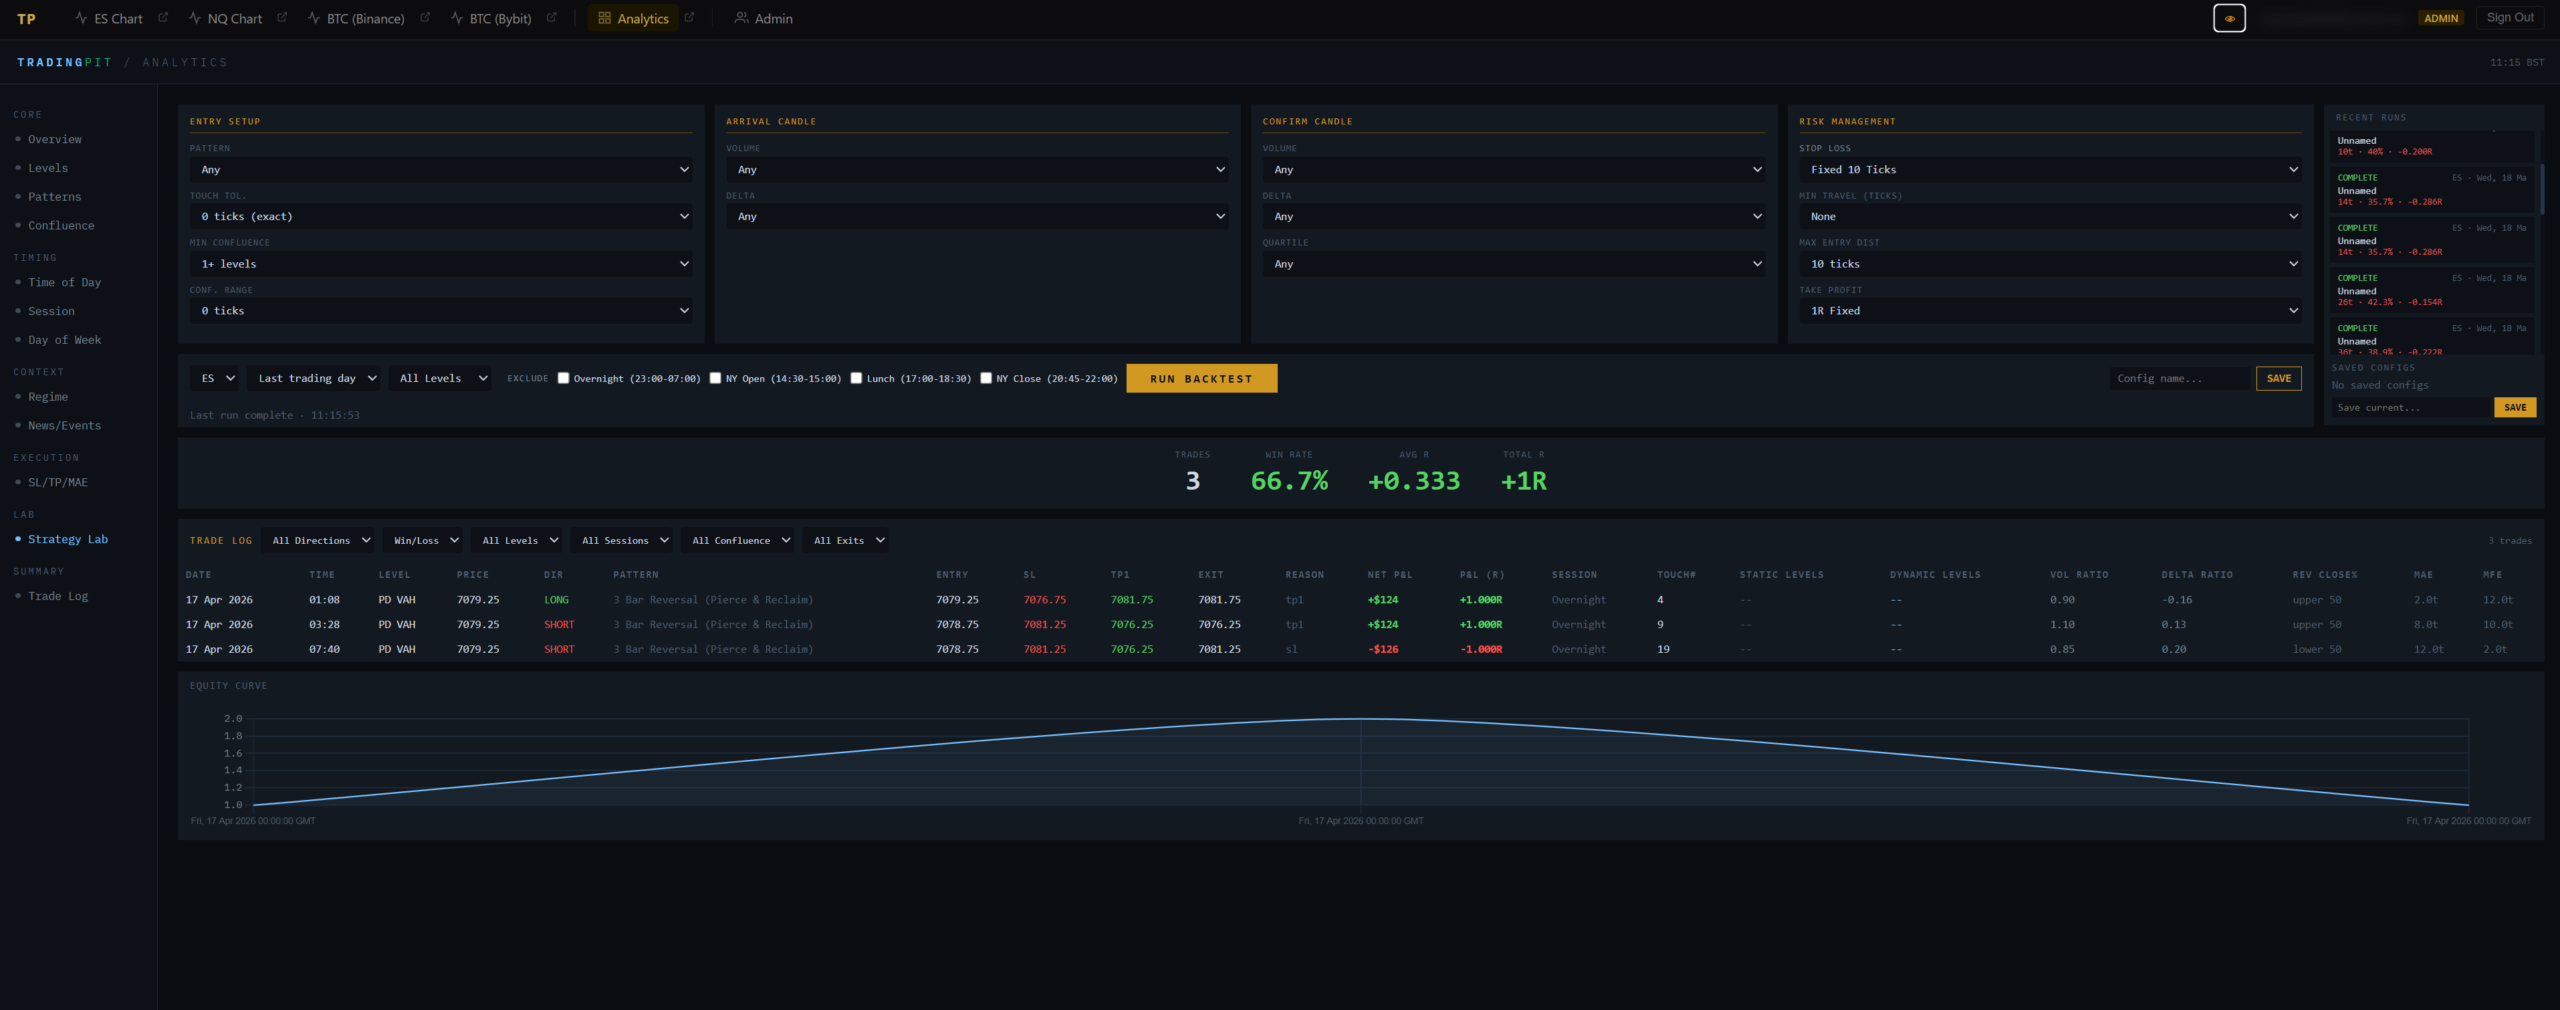
The analytics engine is the most technically complex part of the platform. A trader configures a full trade setup — entry pattern, arrival candle criteria, confirmation candle criteria, session filters, stop loss type, take profit method — and the engine backtests that exact configuration against the full historical database. Win rates, average R, total R and full trade logs are returned in seconds. A saved config system allows traders to store, iterate and compare setups.
The database currently holds 114,686 backtested trade records across 264 days of historical data, with the full backtest pipeline still completing. Every trade stores 20+ data points including session, level type, delta, volume ratio and confluence count.
10 live services.
One control centre.
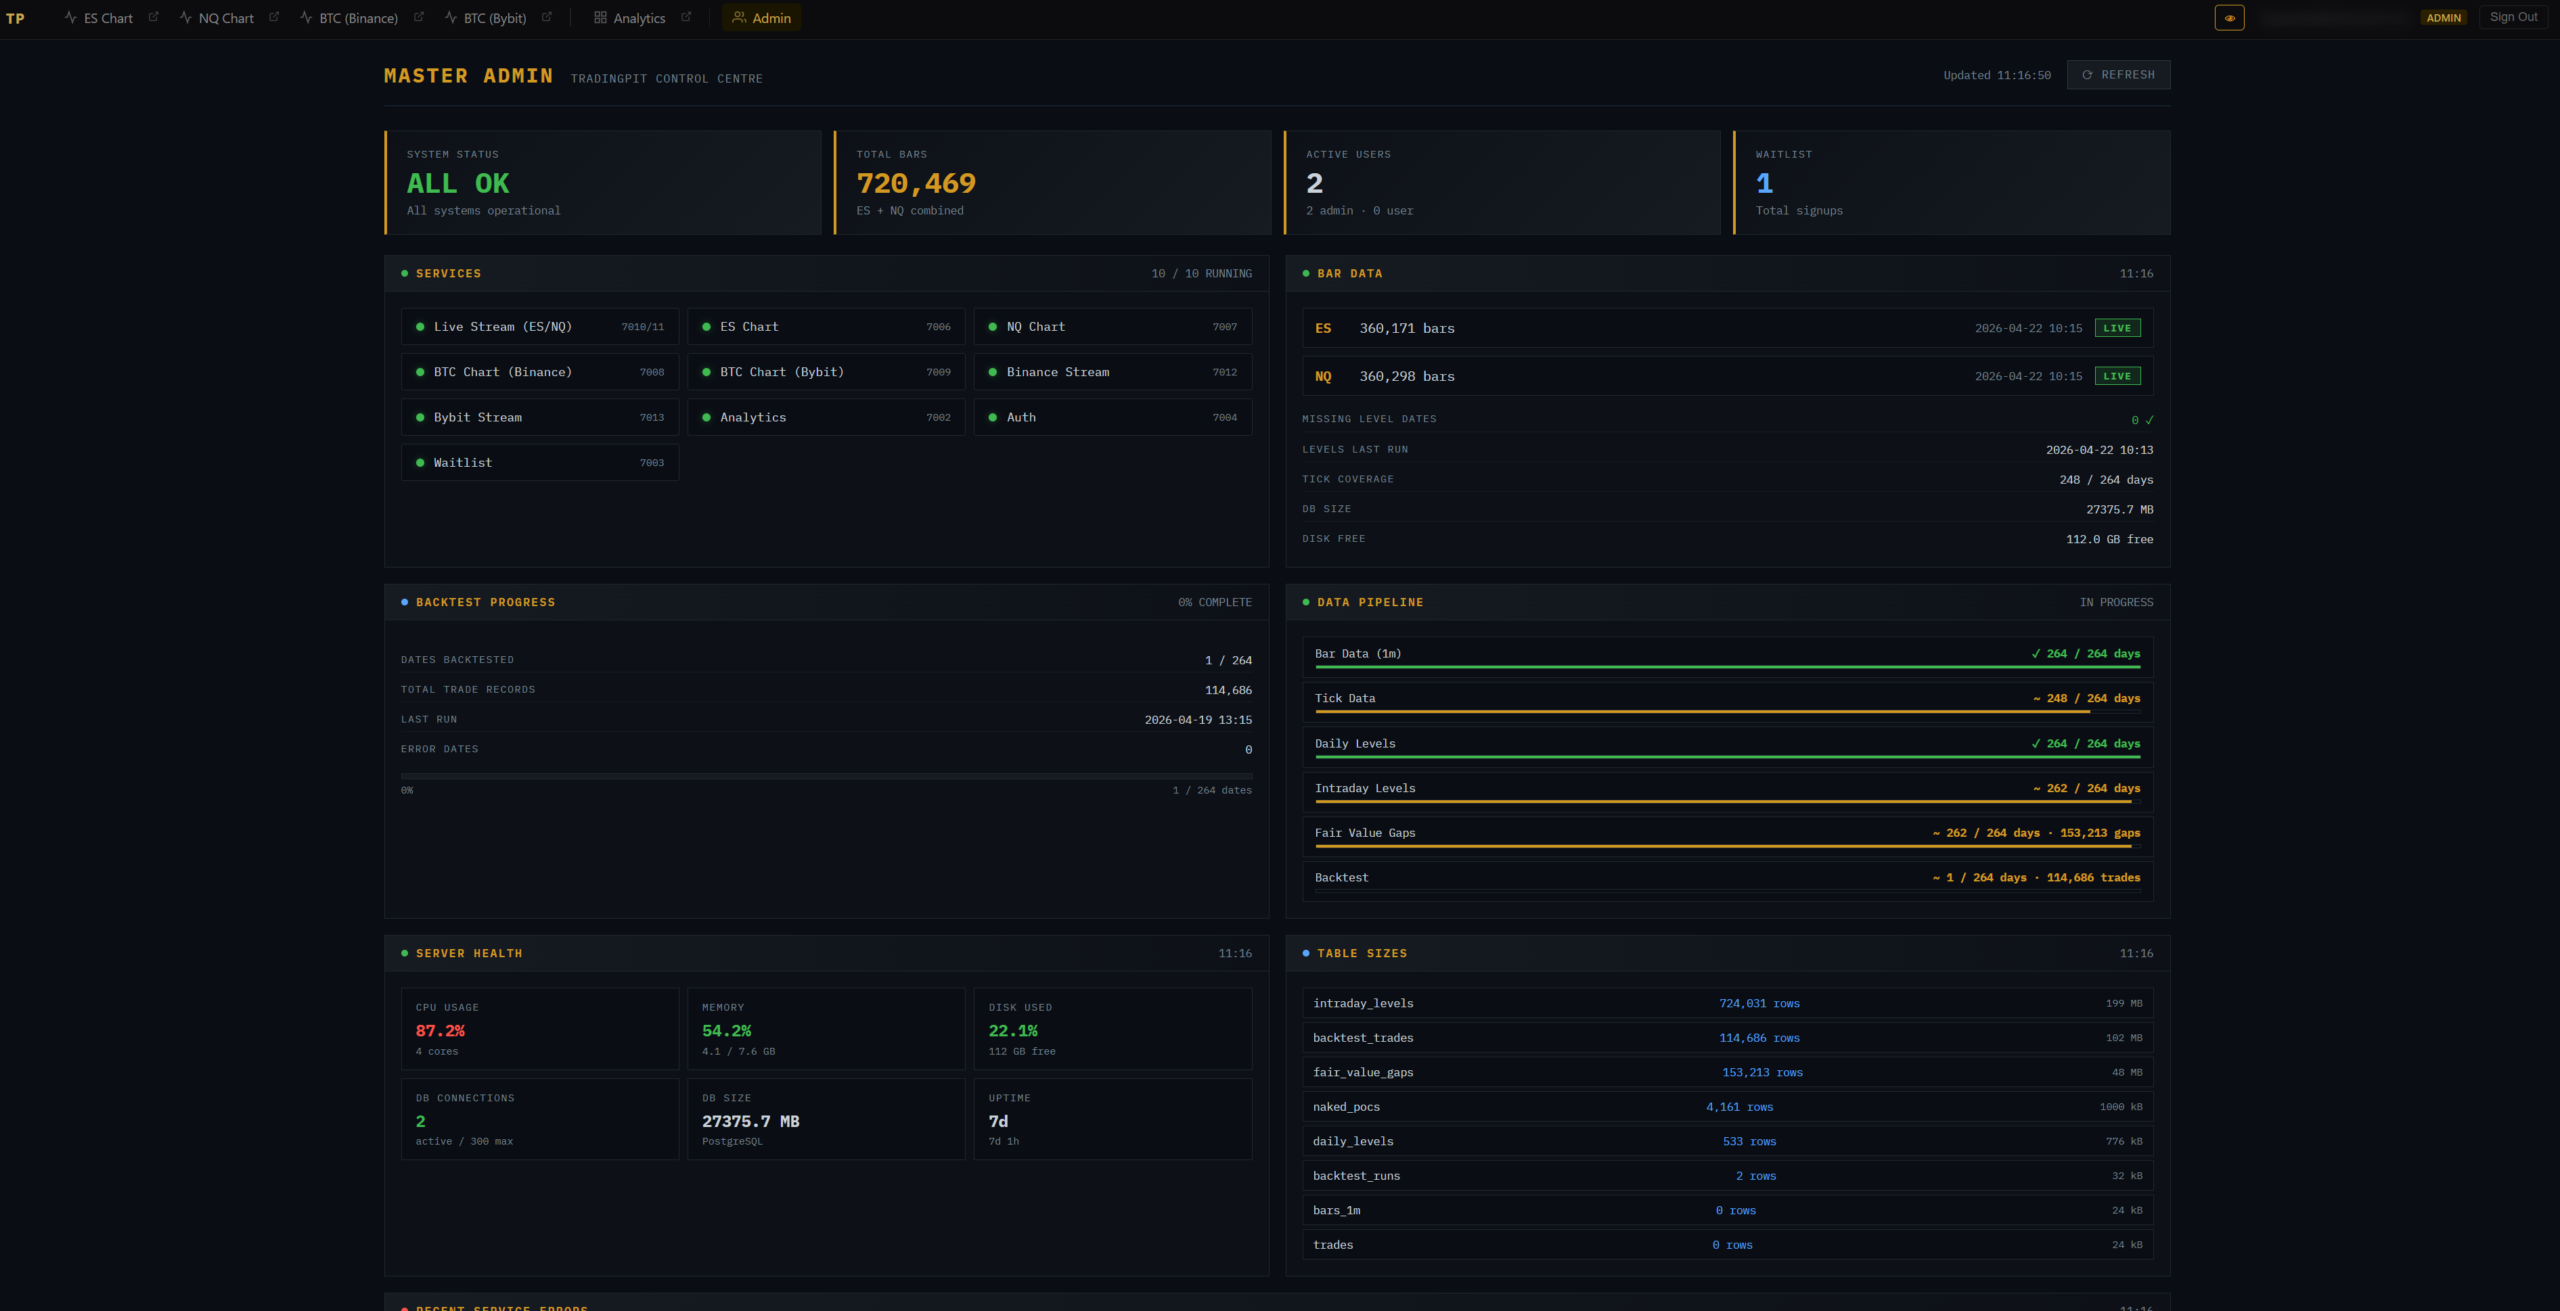
A custom master admin dashboard monitors the entire platform in real time. System status, all 10 running services with their port numbers, bar data counts per instrument, data pipeline progress, server health (CPU, memory, disk, DB connections) and full table size monitoring. Every component of the platform is visible and controllable from a single screen.
Built for scale.
From day one.
The entire platform runs on a Hetzner dedicated server with a PostgreSQL database currently holding 27GB of market data. The infrastructure is capacity-tested to handle 2,000–4,000 paying subscribers without hardware changes. 10 independent systemd services run simultaneously — each stream, each chart, the analytics engine and the auth service all run in isolation so a failure in one cannot affect the others.
Every component.
From scratch.
Three simultaneous WebSocket feeds ingesting tick data from Databento, Binance and Bybit. Custom tick storage system with ATAS-exact accuracy for professional-grade volume profile calculations.
Automated nightly engine calculating 100+ institutional price levels per instrument — Previous Day/Week/Month POC/VAH/VAL, VWAP sessions, Opening Ranges, Moving Averages, Fair Value Gaps and Single Prints.
Fully configurable backtesting system allowing traders to test any entry pattern, candle criteria, session filter and risk management combination against 264+ days of historical tick data. 114,686 trade records processed.
Professional chart interface built on React with TradingView Lightweight Charts. Live candlestick data, independently toggleable level overlays, multi-timeframe support, replay mode and cross-venue comparison.
User authentication with tiered access control. Multiple access tiers enforced at the API layer. Stripe integration for subscription billing with webhook-driven tier management.
Custom admin dashboard showing real-time system status, all service health, bar data counts, data pipeline progress, server health metrics and database table sizes. Full operational visibility from one screen.
The roadmap.
Already planned.
TradingPit is being built in tiers. The core platform is live and in active development — the features below are already scoped, designed and in the build queue. Each tier adds a new layer of capability on top of the live data infrastructure already running.
Live economic calendar integration — high-impact news events (Fed decisions, NFP, CPI) overlaid directly on the charts at their scheduled time. Traders see exactly when volatility catalysts are due relative to current price and key levels. API integration with a financial news data provider for real-time event feeds.
Simulated trade execution directly from the platform — enter, manage and exit paper trades at live prices against real levels. Full P&L tracking, position sizing, risk management rules and session-by-session performance review.
The full analytics engine made available to all users — configure any entry setup, backtest against 264+ days of tick data, filter by session, level type, confluence count and delta. Win rates, average R and full trade logs returned in seconds.
A structured trade journal that captures real trades against the platform’s levels — entry, exit, setup type, session, result and notes. Automatically matches trades to nearby levels at entry time. Performance statistics aggregated by setup type, session and instrument to identify what’s actually working.
Configurable price alerts triggered when price approaches or touches key levels — delivered via browser notification, email or SMS (Twilio). Set alerts on any level across any instrument. Particularly useful for traders who can’t watch screens constantly but want to know when price reaches a key area.
The data pipeline is instrument-agnostic — adding new futures contracts (Gold, Crude Oil, Bonds) or additional crypto pairs is an extension of existing infrastructure. Cross-venue confluence between CME futures and spot/perpetual crypto markets is already built and will expand as new instruments are added.
Need something
this complex built?
TradingPit is an example of what’s possible when a project requires real API integration, custom data pipelines and bespoke application logic. If you have a complex build in mind, describe it and I’ll tell you what’s involved.